PetroTrack
AI-Powered Weekly Fuel Price Forecast — an n8n automation workflow that scrapes multi-source fuel data, analyzes trends with Groq AI, builds visual infographics, and delivers forecasts to Telegram subscribers every Saturday.
AI-Powered Weekly Fuel Price Forecast — an n8n automation workflow that scrapes multi-source fuel data, analyzes trends with Groq AI, builds visual infographics, and delivers forecasts to Telegram subscribers every Saturday.
A fully automated fuel price forecasting pipeline powered by AI and delivered via Telegram
Runs every Saturday at 5PM to generate next-week fuel price forecasts, ensuring subscribers get timely insights before the week starts.
Collects fuel prices from multiple online sources to gather comprehensive and up-to-date pricing data across different regions.
Fetches current currency conversion data to normalize prices across different currencies and provide accurate cross-market comparisons.
Groq AI analyzes historical trends, current market data, and exchange rates to predict upcoming fuel price movements with intelligent reasoning.
Creates a visual forecast report using HTML/CSS templates, transforming raw AI analysis into a clean, shareable infographic format.
Converts the HTML infographic to an image and automatically sends it to all Telegram subscribers, ensuring seamless delivery.
Built with n8n automation platform and modern AI-powered tools
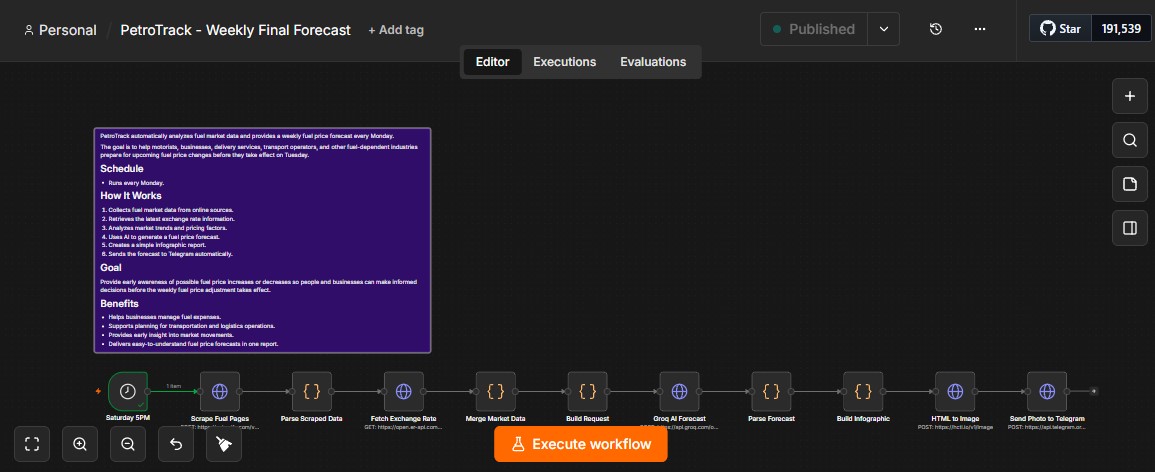
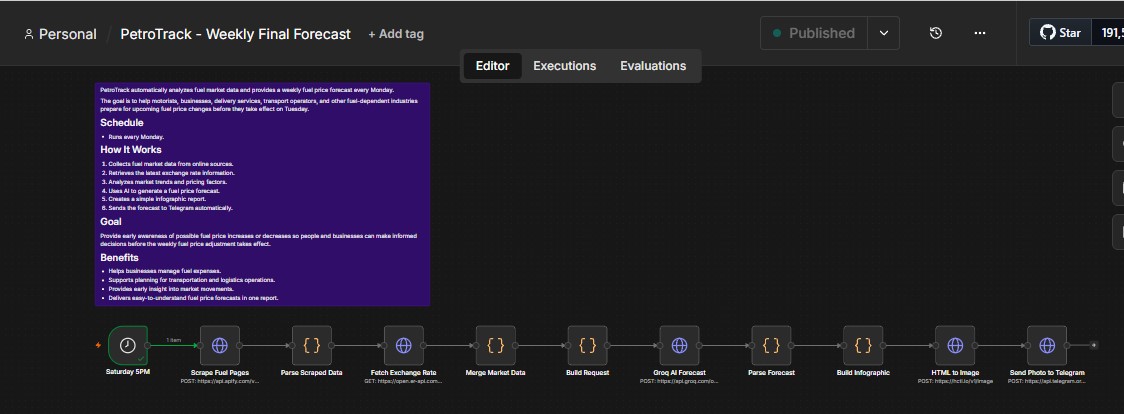
A four-step automated pipeline from data collection to forecast delivery
The workflow kicks off automatically every Saturday at 5PM via n8n's Schedule Trigger node.
Multiple web sources are scraped for current fuel prices and exchange rates, aggregating data from different markets.
Groq AI processes the collected data, identifies patterns, and generates predictions for next week's fuel price movements.
An infographic is built from the AI analysis, converted to an image, and automatically delivered to Telegram subscribers.
Explore the workflow or get in touch to discuss how AI-powered automation can transform your business processes